Noah Brier | August 12, 2020
Why is this interesting? - The 2x2 Edition
On consulting, presentations, and the enduring power of the four-box
Recommended Products
The book describes the story of the origin of the Boston Consulting Group's growth-share matrix.
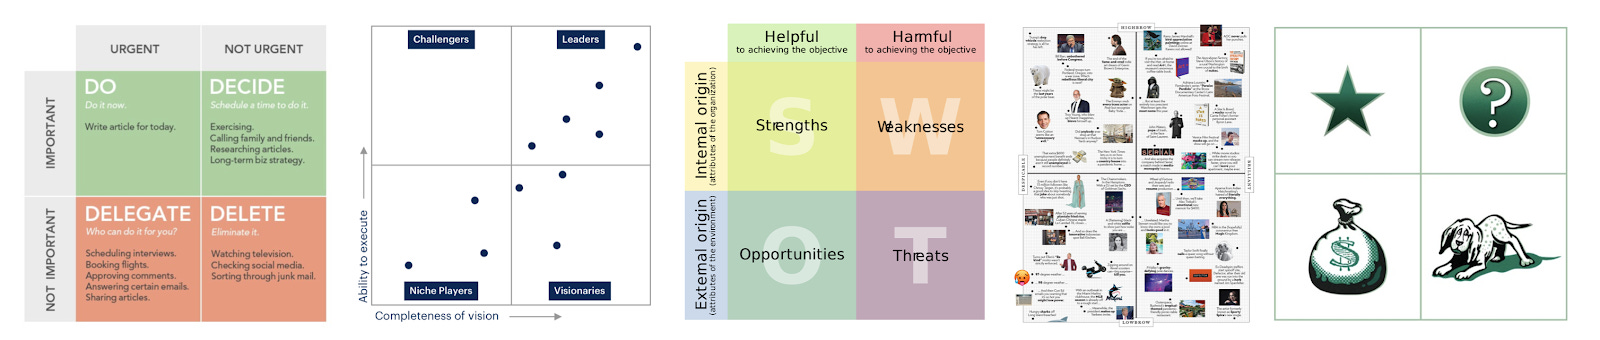
Noah here. I love 2x2s. For the uninitiated, they’re the little charts with four-boxes that frequent WITI emails as a way to understand an idea. In their essence, the 2x2 (alternative name: four-box) is an approach to data visualization. The X-axis represents one spectrum, while the Y-axis represents another. Famous 2x2s include the Eisenhower method (with the axes representing urgent and important tasks), SWOT (origin and effect), Gartner’s Magic Quadrant (execution and vision), New York Magazine’s Approval Matrix (highbrow and brilliant), and Boston Consulting Group’s (BCG) growth-share matrix, which holds a special place in the history of this venerable chart.
While 2x2s are used so often in consulting that they’ve become a kind of joke about whether you can get one into every presentation, they offer real value as a tool for simply explaining ideas. Harvard Business School professor and author Clayton Christensen offered what is easily the most impassioned (and only) defense I found on the 2x2 in his 1997 working paper “Competitive Advantage: Whence It Came, and Where It Went” (also mentioned in the Paradigm Edition):
All scholars who build theory need to create simplified models of what is a very complex reality. Although many factors will affect an outcome, their quest is to identify a few factors that can explain or reliably predict much of what has or will happen. Such simplifications are the essence of all theories or models. In academia, scholars often present their models in mathematical form - positing how a set of variables affect an outcome. Possibly because their clients lack the training to interpret models expressed in mathematical form, most consulting firms present their models in the form of matrices. When a consultant presents a 2 x 2 matrix, she is positing that the result is most strongly affected by two or three variables, which are mapped in the matrix.
Why is this interesting?
Beyond being a fan, my deep dive into 2x2s started with Wikipedia (as so many rabbit holes do). Or rather, the lack of a generic Wikipedia page for the concept of the 2x2 (or four-box or quadrant model if you prefer). Sometimes you learn more from what’s not on Wikipedia than you ever could from what’s there. I wondered how there could be so many pages for specific 2x2s and yet nothing that described the concept generically. There doesn’t even seem to be any agreement on what to call them.
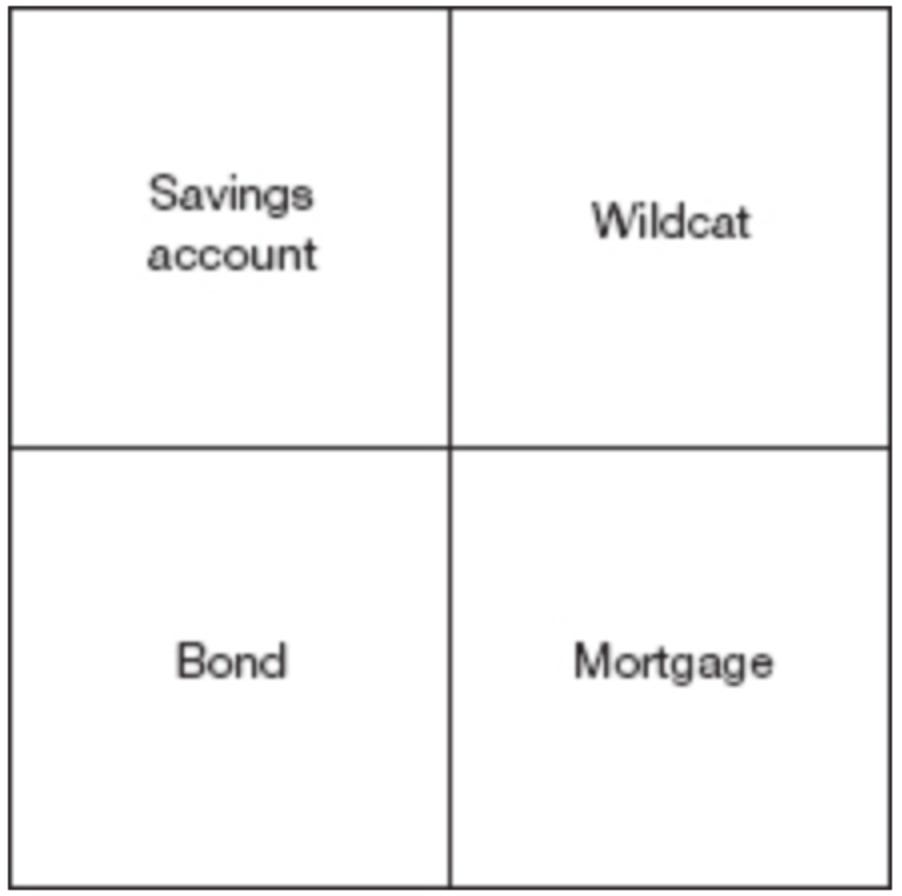
So I started to dig. All sources pointed to Boston Consulting Group’s growth-share matrix. The story of its origin is told in the book Lords of Strategy: The Secret Intellectual History of the New Corporate World. “It occurred to me that the savings account is the growth business; it automatically compounds, but you get no cash out of it,” Zakon explains. “The bond is your stable market-share business that's throwing off cash and an equal amount of earnings and maintains its value over time. The mortgage is the business that's declining, and the way you should manage it is to pull cash out." That of course, describes three elements, not four. The book continues:
“But since I couldn't imagine how to deal with three” -- perhaps sensing, too, that he was one element short of some sort of elegant balance -- "I added the fourth, the wildcat, meaning wildcat well, a pure speculation, either it pays off or it doesn't." The consultants then arrayed the four into a four-box matrix, savings account on the upper left, bond lower left, mortgage lower right, and wildcat upper right.
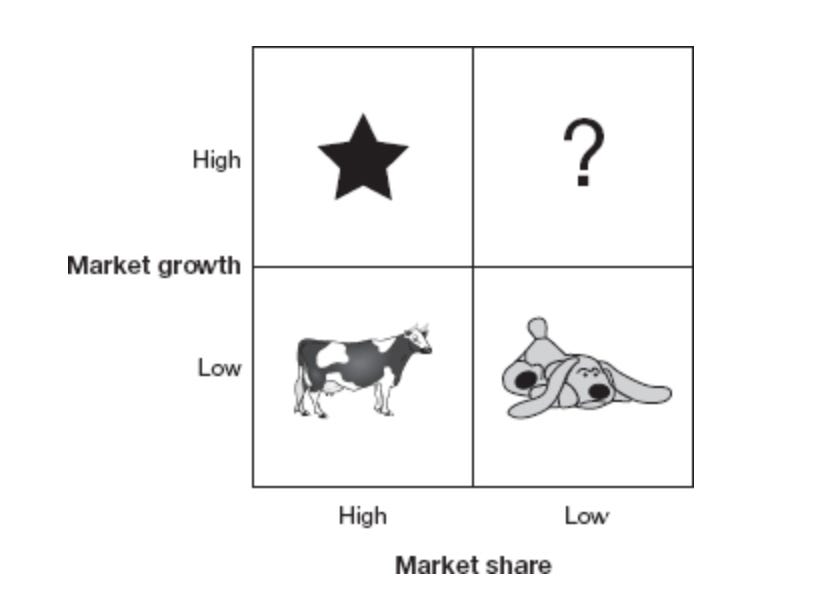
A few years later the words were changed to animals, and the 2x2 as we know it was born.
Something about this story didn’t sit right with me. If 2x2s didn’t exist already, why was Zakon so insistent on finding a fourth element? I began to wonder whether the team at BCG had found their inspiration for the quadrants elsewhere. And so began the dig.
Luckily there weren’t a lot of people talking about business strategy in the 1960s, so it didn’t take long to find the work of Igor Ansoff. Ansoff was born in Russia in 1918 and moved to New York when he was 18 for University. After graduating he joined the RAND Corporation, a think-tank famous for their work with the Air Force, particularly around game theory. He followed that up at aerospace company Lockheed, and eventually moved on to academia.
It was the bit about RAND that sent me searching further. RAND is famous as an important home of game theory, and game theory is “famous” for its use of 2x2s to articulate outcomes.

While that provides a reasonable explanation for why the BCG guys were focused on quadrants (they surely knew about game theory at the time), how did it make the leap to the world of business and ultimately to BCG? As far as I can tell, Igor Ansoff had a plan to take the ideas from game theory and apply them to the corporate world. In 1958 he laid out a vision for a more quantitative approach to strategy, specifically around diversification choices that seems clearly inspired by his time at RAND with the game theorists:
The model presented in this paper is oriented toward the specific purpose of providing top management of a large corporation with a tool for making intelligent diversification decisions. Our purpose will be to make it a reasonably comprehensive and accurate mirror of reality without attempting, for the time being, to provide an algorithm for selection of "optimum strategies." The purpose will be to identify the variables which have a first-order influence on diversification decisions and to identify important structural relations among them. In the language of classical physics we appear to be dealing with a step which is intermediate between a "description" and a "model." If this effort is successful, the results should provide management with a means for making informed diversification decisions through a combination of computation and judgment.
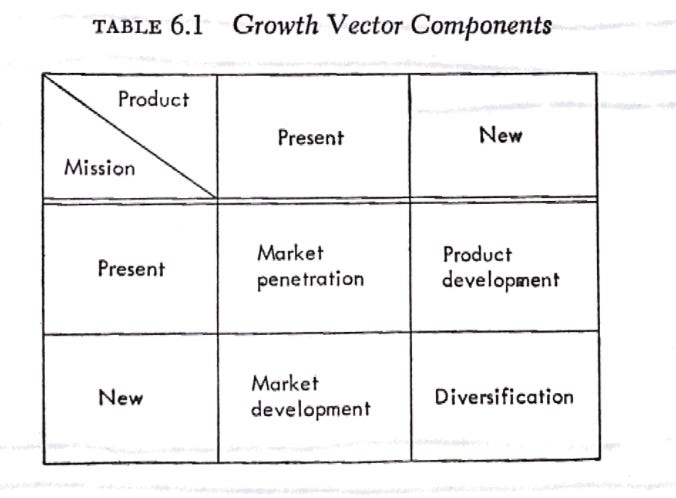
And then, in 1965 Ansoff released Corporate Strategy, one of the first books specifically devoted to the subject. The book was described as “a halfway house” between “current efforts to view the firm as a quantifiable system whose performance can be described in a complex model that can be used for administrative purposes by sophisticated managers, at the other” by The Journal of Business in 1966. In the book, clear as day on page 109, is a 2x2 that unquestionably predates BCG’s growth-share matrix. In fact, Ansoff’s matrix also approaches the question of driving growth and share, though it aims to articulate an individual company’s strategic approach rather than BCG’s attempt to categorize multiple companies in the same matrix.
With that, as far as I can tell, Igor Ansoff set off a revolution in the visualization of business strategies. While it may seem silly to spend this amount of time diving into the concept of the 2x2 rather than the content of some of the most famous matrices, in this case, I think the medium is the message. Strategy is far too often disconnected from execution and simple tools like 2x2 matrix attempt to make it more accessible and therefore more easily acted upon by individuals within an organization. Or, as Clayton Christensen explained in his defense of the 2x2, “Academics and consultants ought not ridicule each other for committing oversimplifications, or for being too obtuse or abstract. Both are engaged in the same theory-building pursuit, but because of their circumstances, find it preferable to communicate their models in different ways.” (NRB)
2x2 of the Day:
A friend asked for a 2x2 of 2x2s and this is what I came up with (inspired by the cry of all high school football coaches, “arms are for show, legs are for dough”). (NRB)

Quick links:
The mystery behind Chinese seeds arriving in the mail (CJN)
Interplanetary cargo ships (via BP) (CJN)
How the pandemic defeated America (CJN)
Thanks for reading,
Noah (NRB) & Colin (CJN)
PS - Noah here. Variance, my new company, is just getting going with our Alpha. If you work in sales, services, marketing, or engineering and want to try out/give feedback on a tool to help your team work more effectively with their apps, please request an invite on the site. Thanks.
—
Why is this interesting? is a daily email from Noah Brier & Colin Nagy (and friends!) about interesting things. If you’ve enjoyed this edition, please consider forwarding it to a friend. If you’re reading it for the first time, consider subscribing (it’s free!).